
How to Build a Supplier Scorecard That Changes Behaviour

A supplier scorecard is a small set of measured, weighted criteria reviewed on a fixed cadence, tied to a stated consequence. Four or five metrics is usually enough: on time in full delivery, a defect rate in parts per million, a cost measure such as purchase price variance, and a responsiveness measure. What makes it work is not the arithmetic. It is that the supplier knows the weights in advance, sees the same numbers you see, and understands what happens at each score band. A card the supplier has never been shown is an internal opinion, not a management tool.
This guide is for importers and sourcing teams running anywhere from five to fifty overseas suppliers. It covers how to segment before you score, the metrics that belong on the card and their real formulas, why the benchmark figures you find online are unreliable, how weighting actually works, and the escalation ladder behind the score. If you are still setting suppliers up, start with our supplier onboarding process.
Segment Before You Score
Scoring every supplier the same way is the first mistake, because a packaging vendor and a sole source custom molder do not deserve the same attention. The standard tool for this predates most of the software that claims to have invented it. Peter Kraljic set it out in "Purchasing Must Become Supply Management" in the Harvard Business Review in September 1983, plotting purchases on two axes: profit impact and supply risk.
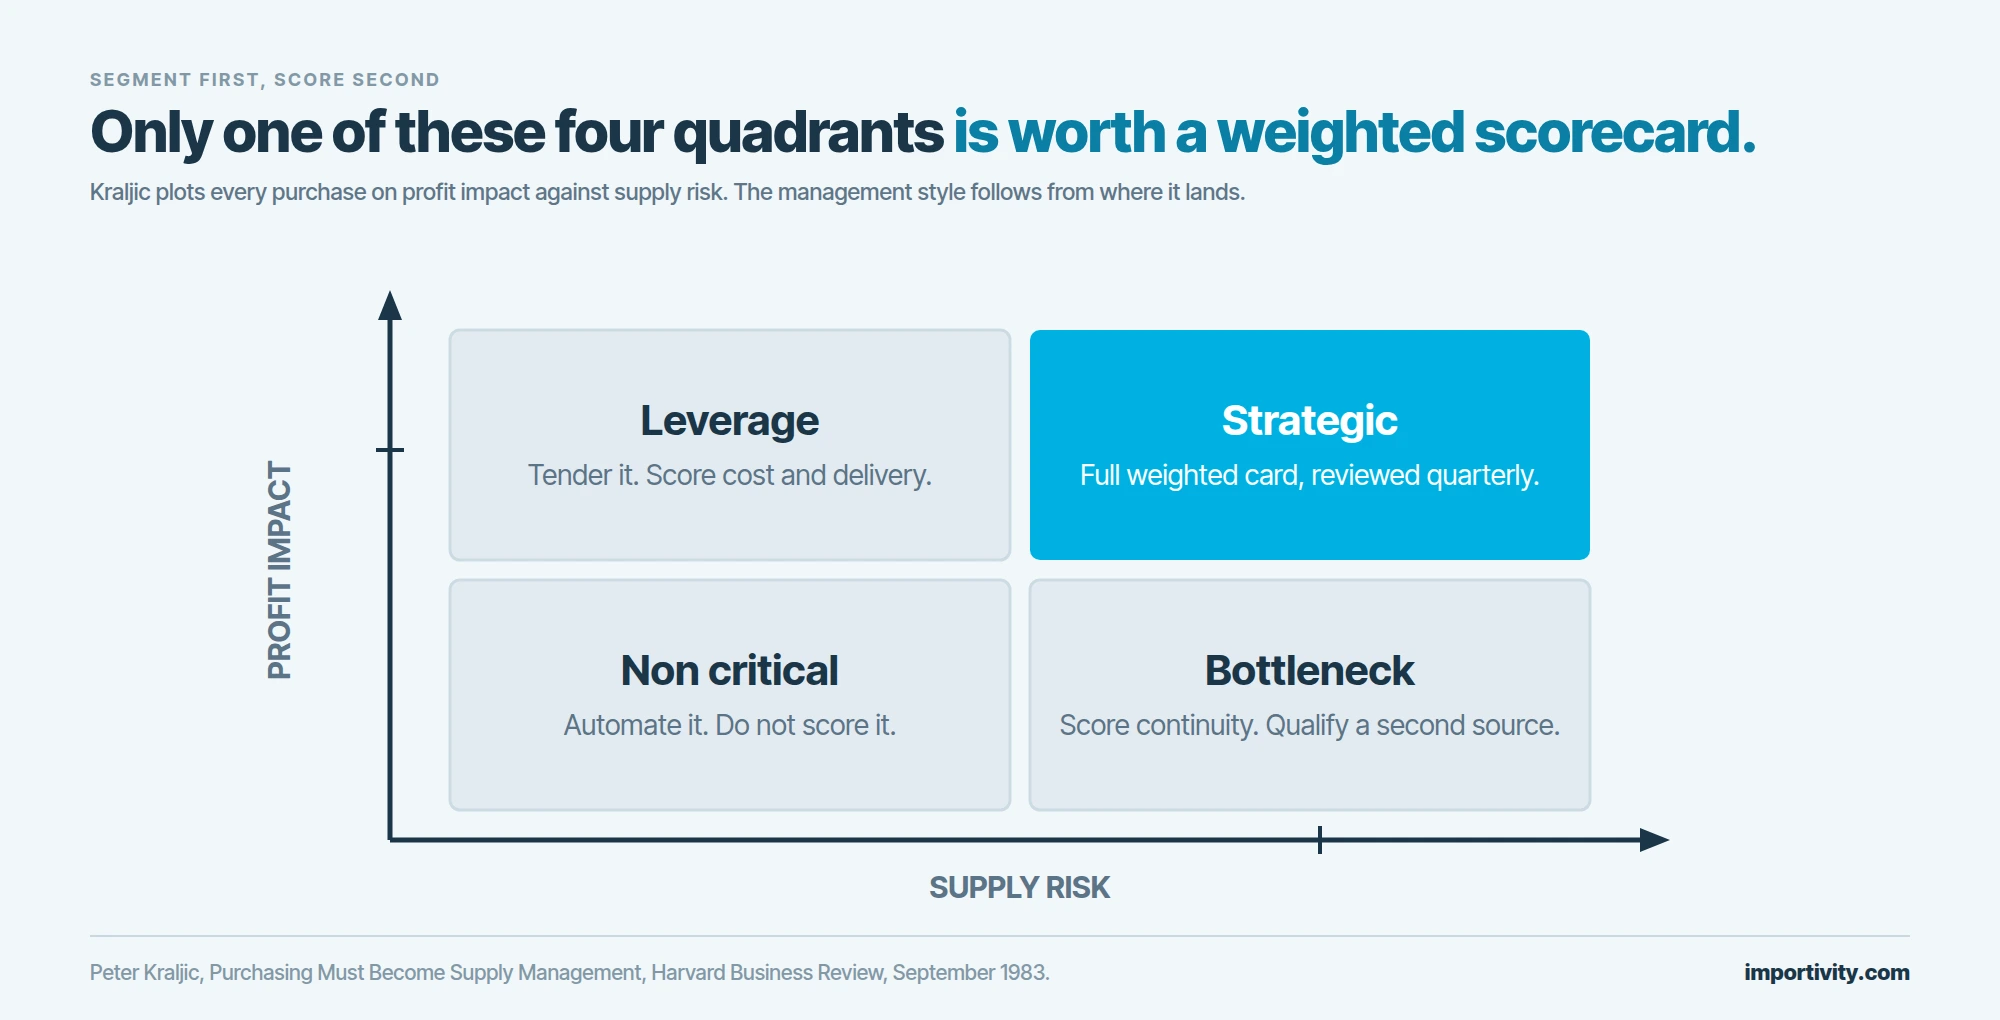
The four quadrants imply four different management styles. Non critical items need automation, not scorecards. Leverage items are where competitive tendering pays, so score on cost and delivery. Bottleneck items carry low spend but high risk, usually because there is one qualified source, so score on continuity and responsiveness and start qualifying a second supplier. Strategic items are high spend and high risk together, and they are the only category where a full weighted scorecard with quarterly reviews earns the time it costs.
The practical output is that most buyers should be running detailed scorecards on perhaps five to ten suppliers, not on all of them. If your programme feels like data entry, you segmented too coarsely. Our guide to building a supplier network that withstands disruption covers the continuity side of the bottleneck problem.
The Metrics That Belong on the Card
Use standard definitions rather than inventing your own, because a supplier that works with several US customers will already recognise these and can be held to them without an argument about arithmetic.
| Metric | How it is calculated | What it actually tells you |
|---|---|---|
| On time in full, OTIF | Orders delivered both on time and complete, divided by total orders, times 100 | Reliability as the customer experiences it. An order fails if either condition is missed |
| Defect rate in parts per million | Defects divided by units inspected, times one million | Quality at a resolution that survives large volumes, where percentages stop being useful |
| First pass yield | Good units divided by total units, counted at first pass with rework excluded | Whether the process is capable, rather than whether inspection is catching things |
| Purchase price variance | Standard price minus actual price, times quantity purchased | Cost drift against plan. Confirm the sign convention before you publish it, since sources differ |
| Lead time variance | Actual lead time minus planned, or the coefficient of variation across orders | Whether you can plan around the supplier. Consistency matters more than speed |
| Responsiveness | Elapsed time from RFQ or query sent to a complete reply | A practitioner convention rather than a defined standard, but it predicts trouble early |
Two of these are worth extra care. Perfect order rate is a stricter cousin of OTIF that requires the right place, product, time, condition, packaging, quantity, documentation and invoice, so a correct delivery with a wrong invoice fails it. Use it only if you can actually capture all eight. And cost of poor quality, defined as internal plus external failure costs within the wider cost of quality framework, is the number that converts a defect rate into a figure your finance team will act on.
If you want a formal anchor, ASCM's SCOR model organises more than 150 supply chain KPIs under eight performance attributes, with perfect order fulfillment sitting at the top level of the reliability attribute. It is a good place to standardise definitions across a team.
The Benchmark Problem Nobody Admits
Search for a target and you will find confident numbers: OTIF should be above 95 percent, world class defect rates are under 50 parts per million, cost of poor quality runs 10 to 30 percent of revenue. Nearly all of them trace back to vendor marketing content with no survey, no sample and no methodology behind them, and they contradict each other freely.
Here is the detail that settles it. IATF 16949, the automotive quality standard that gave the industry PPM as a language in the first place, does not mandate any specific PPM number. Its supplier monitoring clause requires an organisation to define and monitor its own performance indicators, listing conformity of delivered product, customer disruptions including yard holds and stop ships, delivery schedule performance, premium freight occurrences, special status notifications and dealer returns and warranty as the minimum things to track. It sets no threshold. The standard everyone cites as the source of the benchmark explicitly declines to set one.
The same logic sits inside ISO 9001:2015, whose clause 8.4 on control of externally provided processes requires you to define criteria for evaluating, selecting and monitoring external providers, without telling you what the criteria should be. Both standards are asking you to decide, then be consistent.
So set your baseline from your own data. Measure current performance for one quarter without publishing a target, then set the target above the baseline and below the best supplier in the category. That number is defensible in a review because it came from your own orders. An imported benchmark is not, and a supplier who has been in the industry longer than you will say so.
How to Weight It
There is no published standard weighting, and we could find no survey establishing what companies actually use. What the practitioner examples do show is that the weights swing hard by category, which is the useful finding.
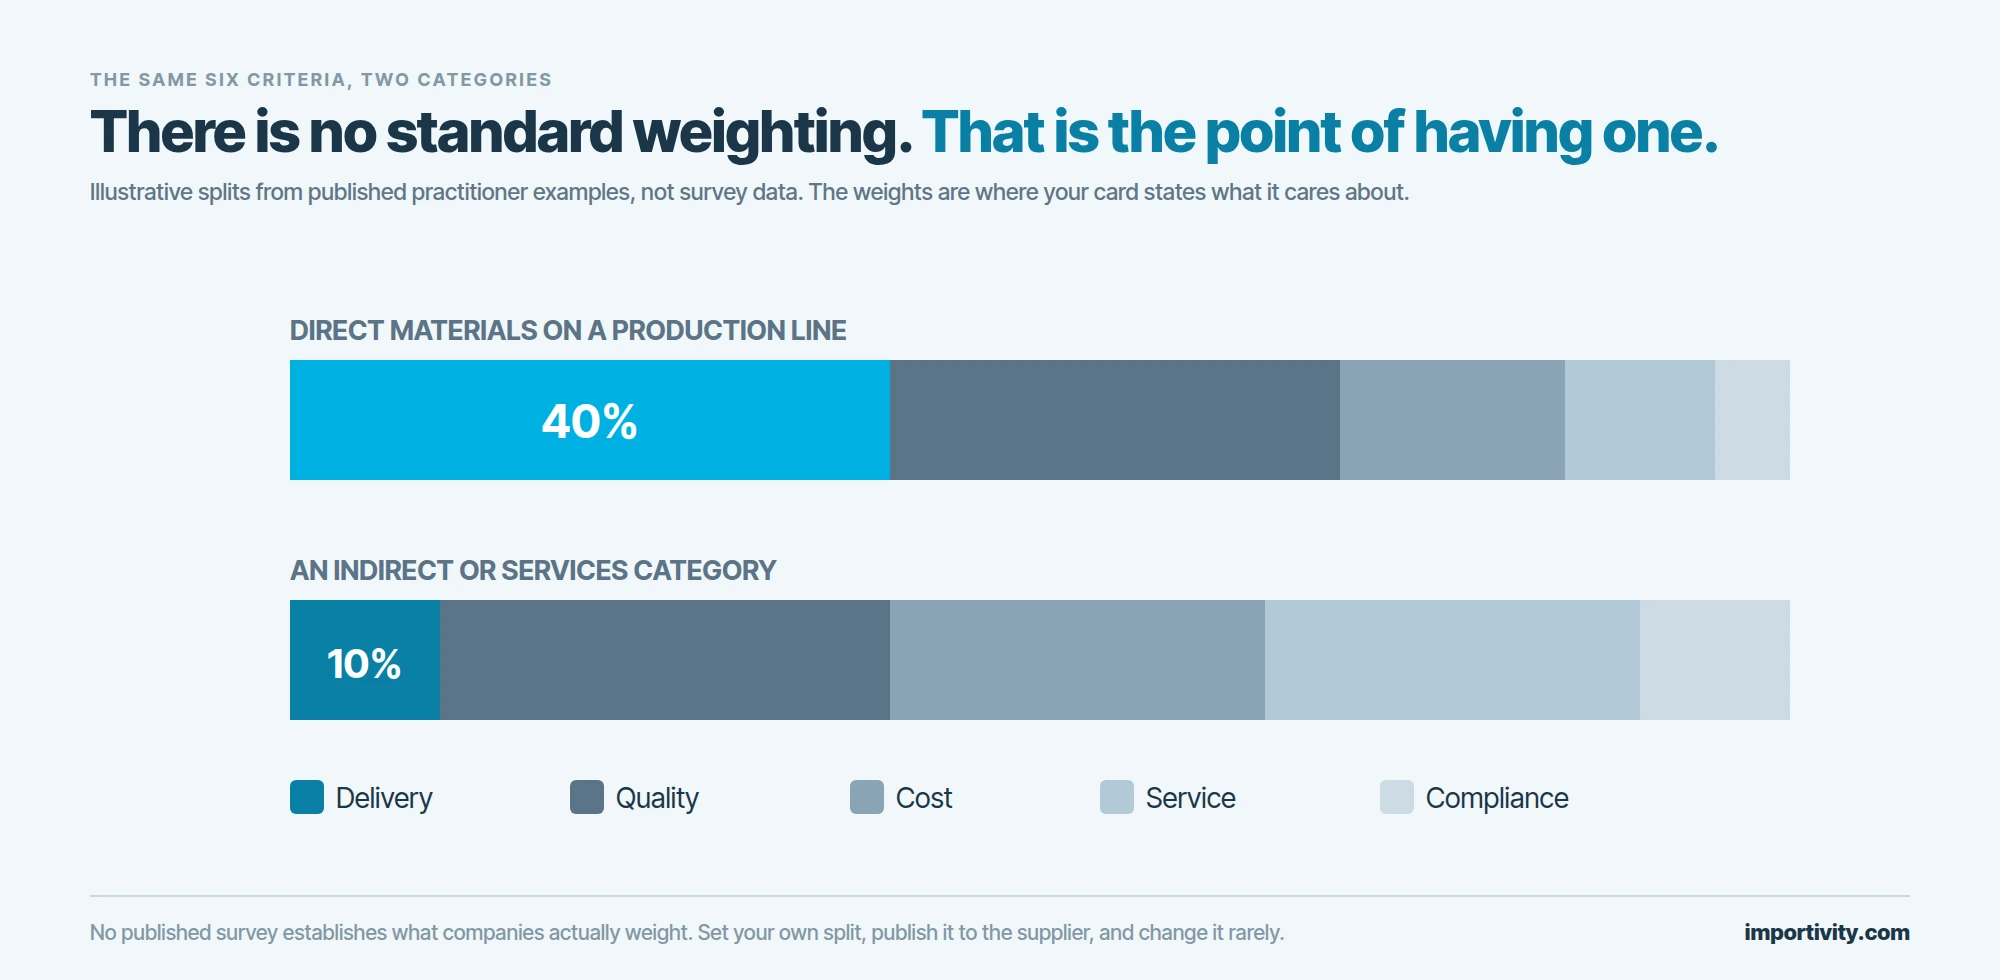
For direct materials feeding a production line, delivery dominates, because a late component stops the line and no unit cost saving recovers that. For a services or indirect category, delivery collapses to a formality and cost and service take the weight. The mistake is copying somebody else's split, because the weights are the only place your scorecard says what you actually care about. Write them down, show them to the supplier before the first period, and change them rarely.
Keep the card to four or five criteria. Every additional metric dilutes the ones that matter and adds collection work that eventually kills the programme. If a metric has never changed a decision, take it off the card.
The Cadence and the Escalation Ladder
A score with no consequence attached is a newsletter. Fix the cadence and the ladder before the first review, and tell the supplier both.
Quarterly is the usual rhythm for strategic suppliers, in a structured business review covering the last three months of measured performance and the improvement actions agreed at the previous one. Monthly reporting with quarterly review works well: the supplier sees the numbers monthly and nobody is surprised in the meeting.
The escalation ladder should be explicit. A first miss is handled buyer to supplier. A repeated or serious miss triggers a formal corrective action request, and 8D is the standard structure for that, an eight discipline problem solving format Ford developed in 1987 and the automotive supply base still uses. In regulated categories the equivalent is CAPA, which is a legal requirement rather than a convention: FDA requires it of device manufacturers under 21 CFR 820.100 and ISO 13485:2016 sets it out at clauses 8.5.2 and 8.5.3, with FDA's Quality Management System Regulation aligning the two from February 2026.
Beyond that the ladder runs to probation with a defined review date, active qualification of a second source, and finally exit. Say those steps out loud at the start. A supplier who knows the third missed quarter triggers dual sourcing behaves differently in the second. Our guides on why suppliers miss deadlines and switching suppliers without disrupting supply cover the last two rungs.
What Makes a Scorecard Actually Work
The programmes that survive share a short list of habits, and none of them are about software.
- The supplier sees the same data you do. Send the raw order lines, not just the score. Most disputes are data disputes and they are cheaper to settle monthly.
- Weights are published in advance and rarely changed. Moving the weights after a bad quarter destroys the tool's credibility.
- The card fits on one page. Four or five criteria, a score, a trend, and the actions from last quarter.
- Every metric has an owner and a source system. If a number is assembled by hand each quarter, it will stop being assembled.
- Consequences are stated before they are needed. Bands, and what each band triggers.
- Good performance is worth something. More volume, longer terms, earlier forecasts. A card that only ever punishes gets ignored by the suppliers you most want to keep.
The wider point is that most organisations are not doing this well. Gartner reported in February 2025 that only 29 percent of supply chain organisations had built the capabilities needed to deliver on future performance, and its own supplier quality research has found that the common failing is metrics that react to problems rather than anticipate them. A leading indicator such as responsiveness or lead time variance is worth more than another lagging quality count, because it gives you a quarter's warning.
If you are standing this up from nothing, start with two suppliers, four metrics and one quarter of baseline data. Our supply chain management service and the supplier onboarding checklist cover the setup, and building long term supplier relationships covers the half of this that is not measurement. If you would rather somebody else ran the reviews and held the suppliers to them, that is the work we publish at Source With Jordan.
Frequently Asked Questions
What metrics should a supplier scorecard include?
Four or five is enough. On time in full delivery, a defect rate in parts per million, a cost measure such as purchase price variance, a lead time variance measure, and a responsiveness measure covers most categories. Use standard definitions so suppliers recognise them. Adding more metrics dilutes the ones that matter and adds collection work that eventually kills the programme, so remove any metric that has never changed a decision.
What is a good OTIF percentage?
There is no authoritative benchmark, despite the confident figures circulating online. Nearly all published OTIF targets trace to vendor marketing content with no survey or methodology behind them. Set your own baseline instead: measure current performance for a quarter without publishing a target, then set the target above that baseline and below your best supplier in the category. A number from your own orders is defensible in a review.
Does IATF 16949 set a required PPM defect rate?
No, and this surprises people. IATF 16949 requires an organisation to define and monitor its own supplier performance indicators, listing conformity of delivered product, customer disruptions, delivery schedule performance, premium freight, special status notifications and warranty returns as minimums. It sets no threshold. ISO 9001 clause 8.4 works the same way, requiring you to define evaluation criteria without specifying them.
How should I weight a supplier scorecard?
By what actually hurts you in that category. No published standard exists. For direct materials feeding a production line, delivery usually carries the heaviest weight, since a late component stops the line and no unit price saving recovers it. For indirect or service categories delivery drops sharply and cost and service take the weight. Publish the weights to the supplier before the first period and change them rarely.
How often should supplier scorecards be reviewed?
Monthly reporting with a quarterly structured review is the common rhythm for strategic suppliers. The supplier sees the numbers monthly so nobody is surprised in the meeting, and the quarterly review covers measured performance plus the actions agreed last time. Attach an explicit escalation ladder: a corrective action request such as an 8D for a repeated miss, then probation, then second sourcing, then exit.
About the author
Jordan Lewis
Chief Operating Officer, Importivity
Runs Importivity's sourcing operations across China, Vietnam, Mexico and India, from supplier negotiation through landed delivery.
Press and media inquiries: press@importivity.com